On this page, I display all my illustrations and infographics and share my process.
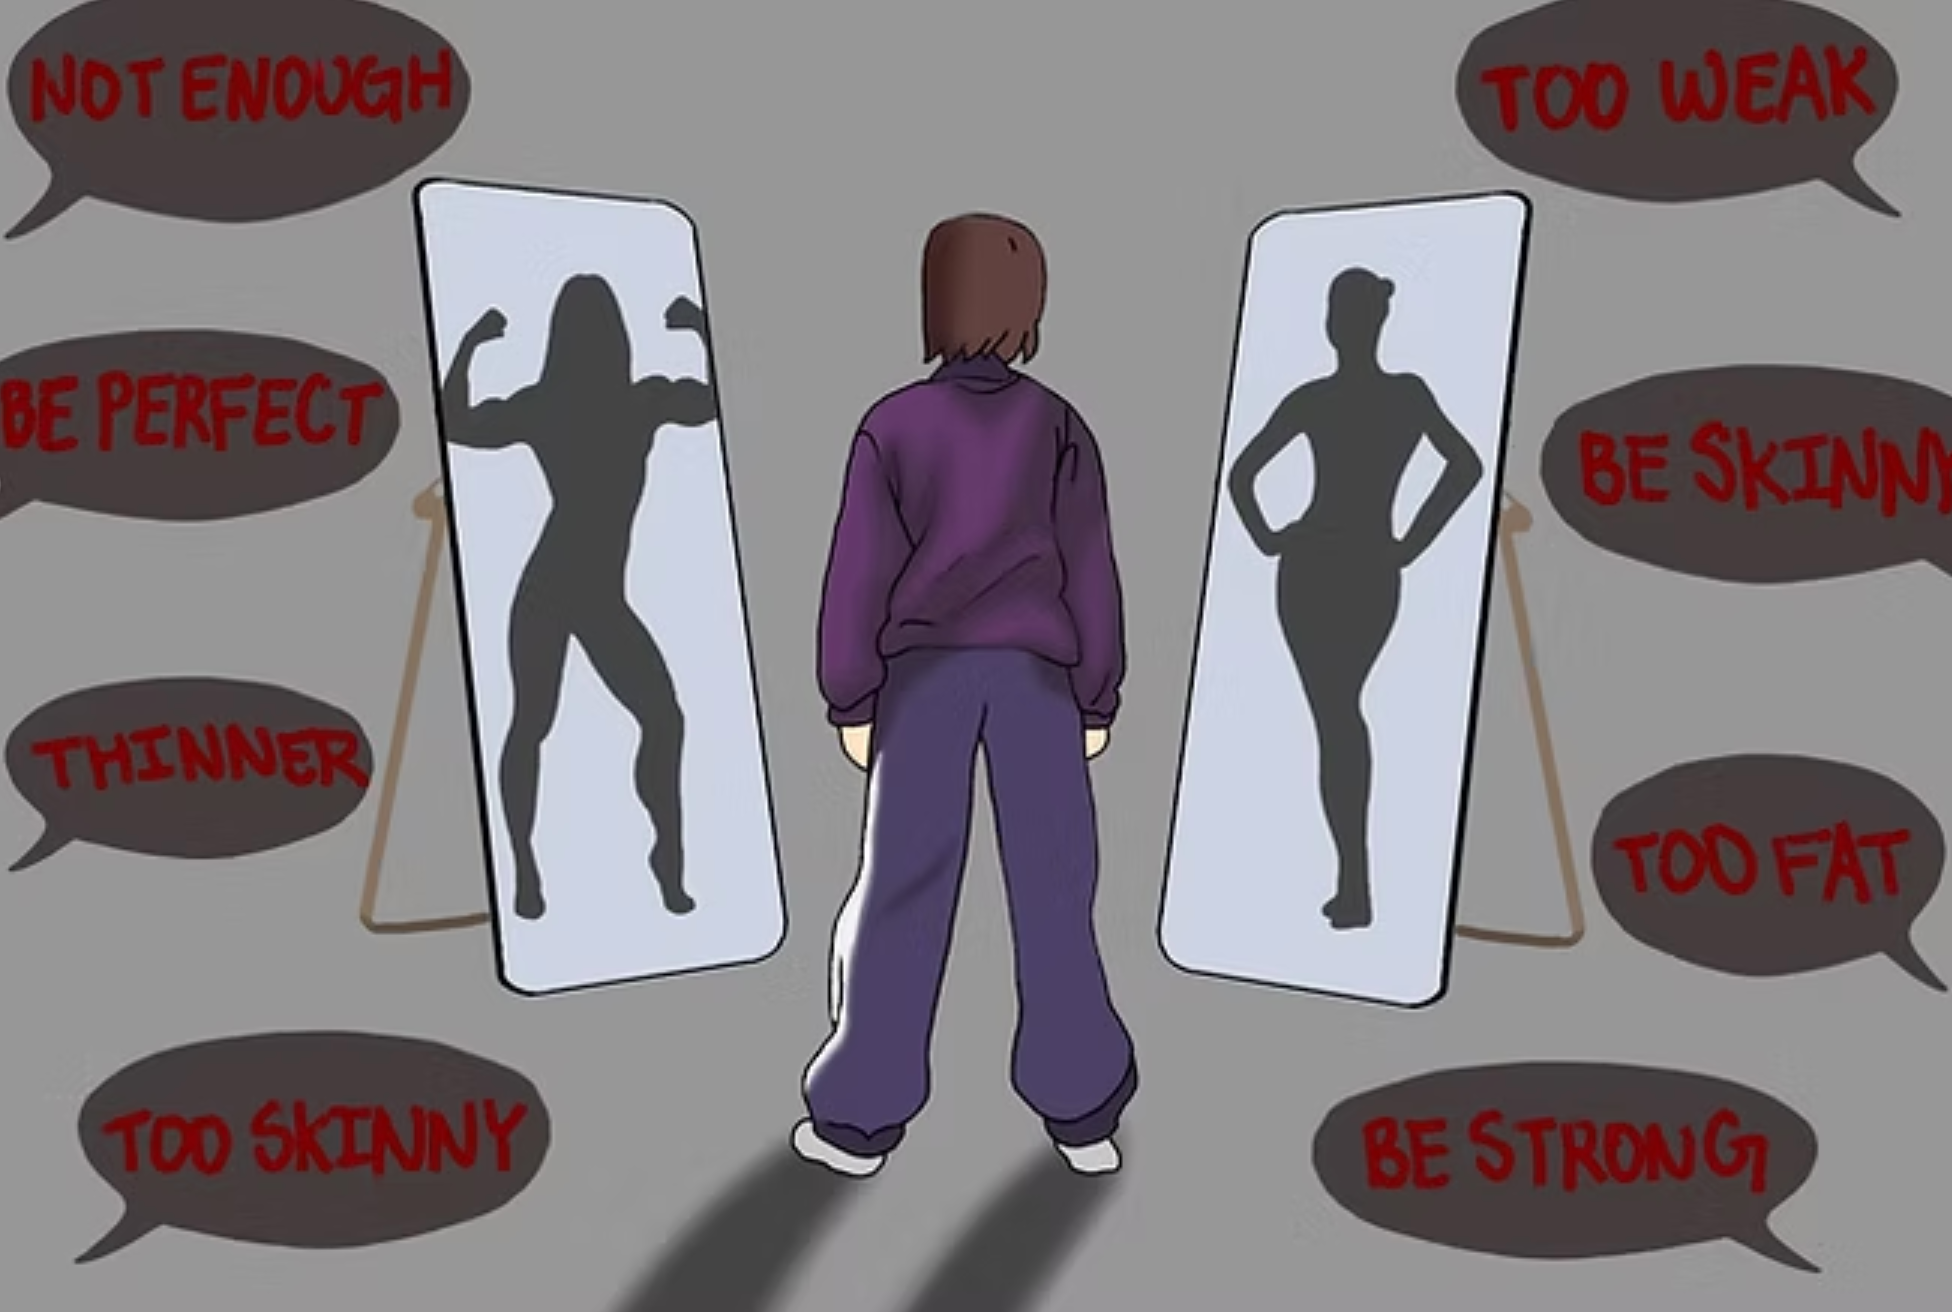
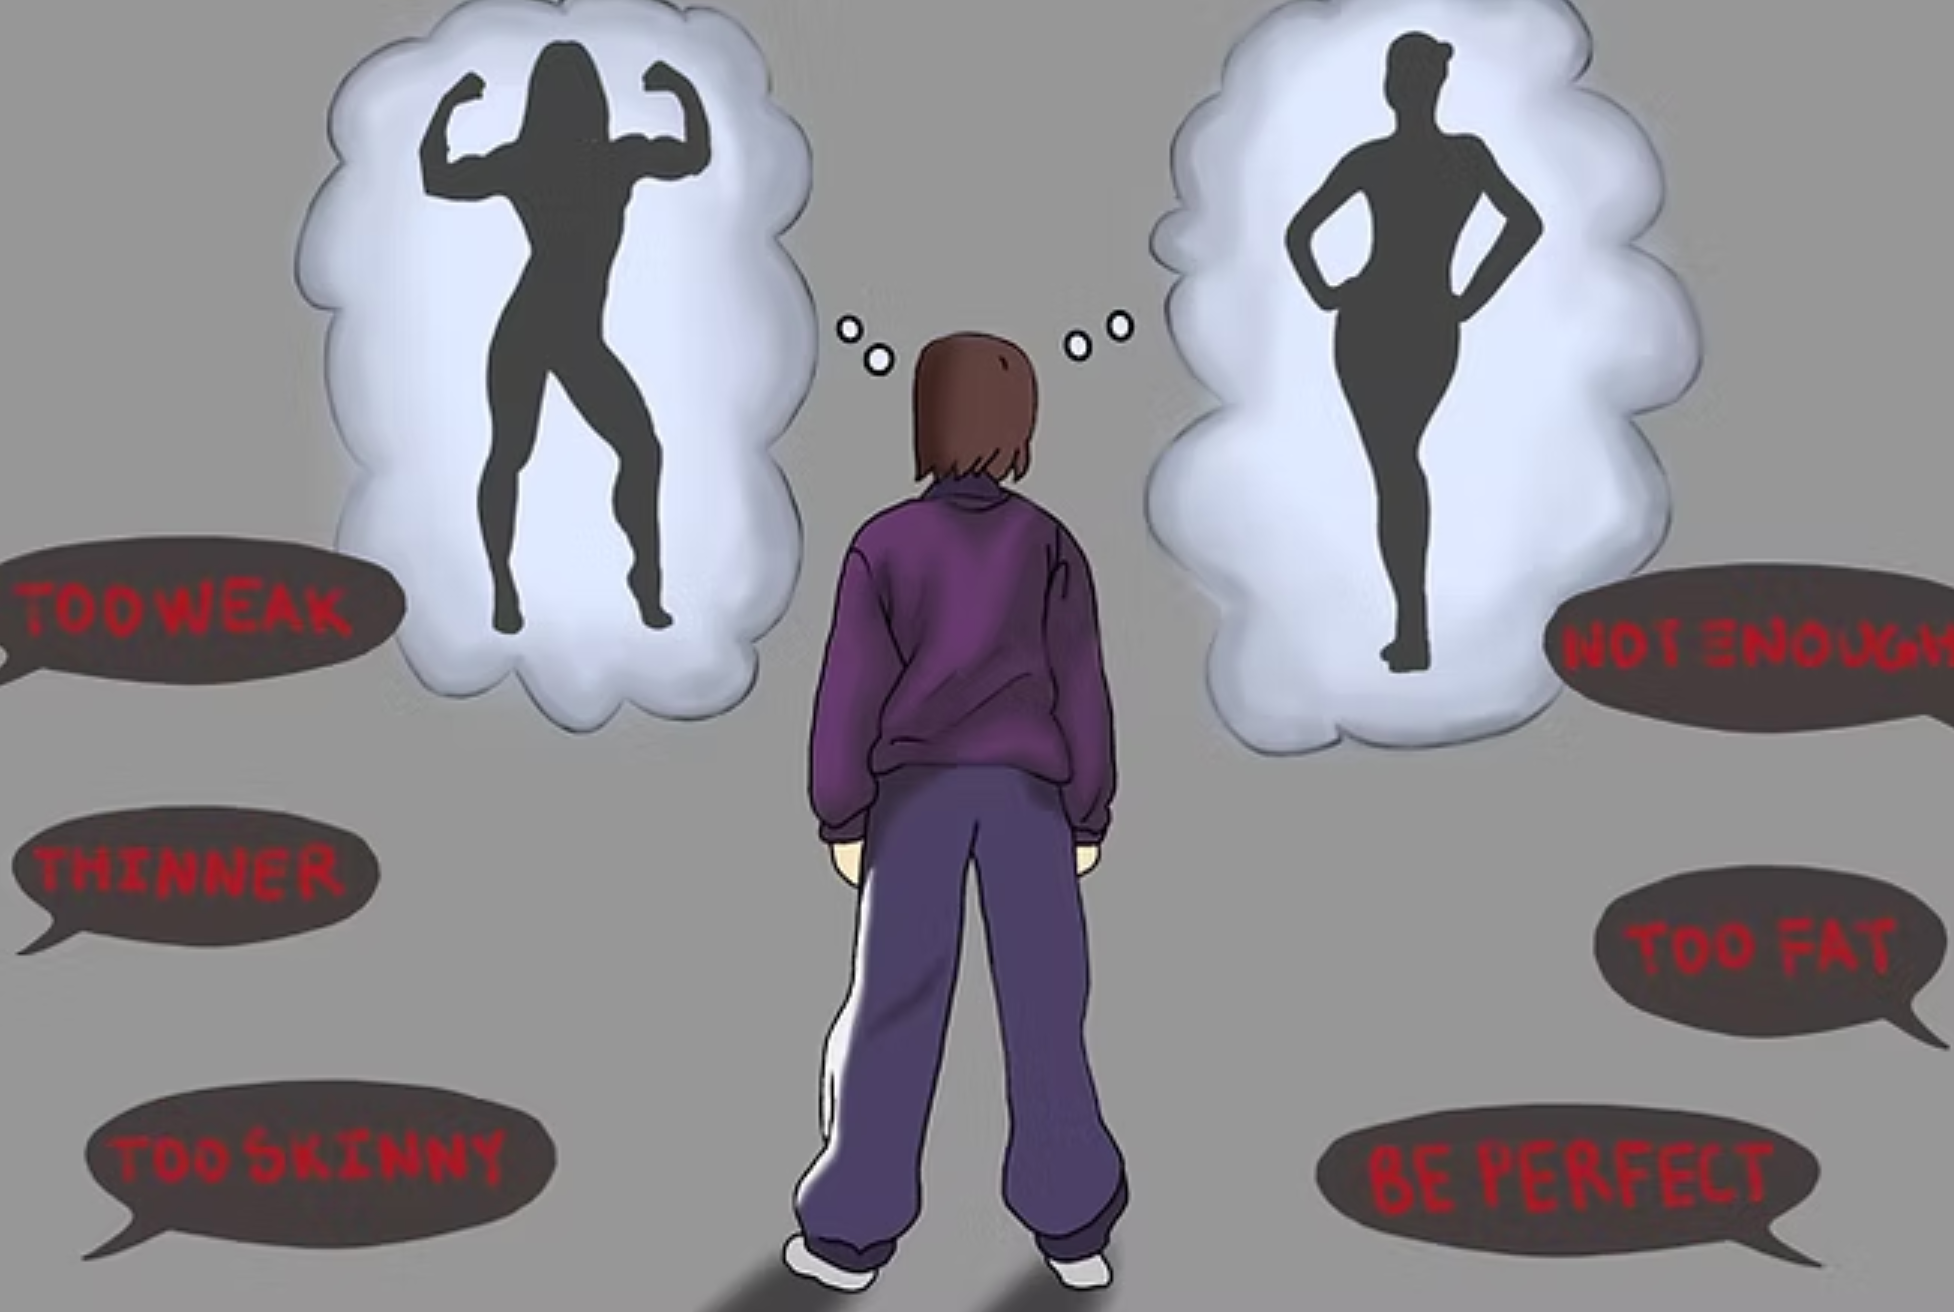
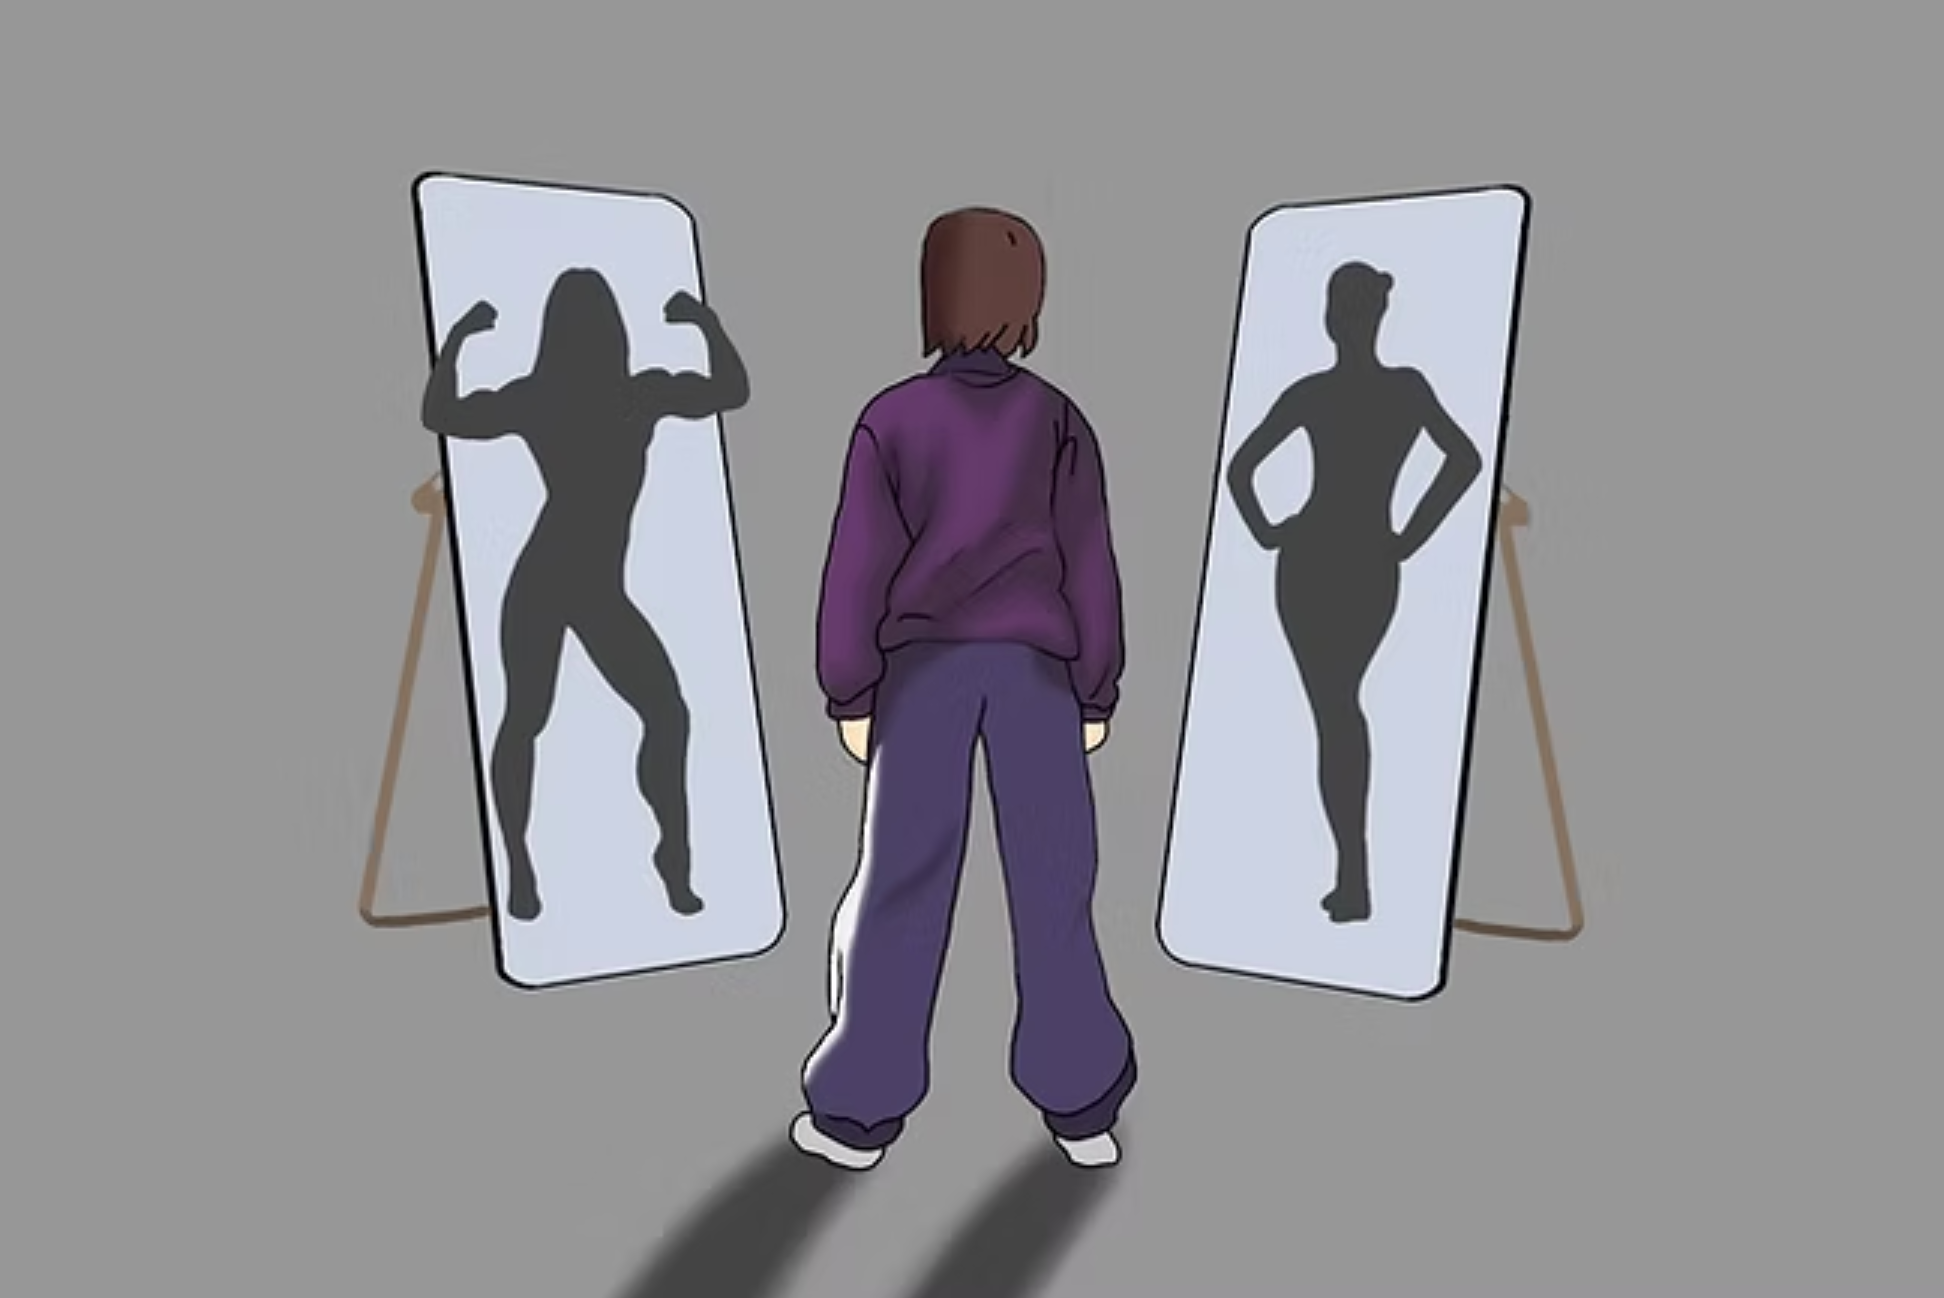
Illustrating was completely new to me as a reporter, but I am grateful I was encouraged to take the jump to start illustrating because it's truly grown my creative abilities. As with every illustration, I made sure to keep in contact with the editors and writers of the piece as I created the piece below. I went through several iterations with the writers, section editor, and editor-in-chief in this specific instance. On the left is my initial draft, and on the right is my final version.

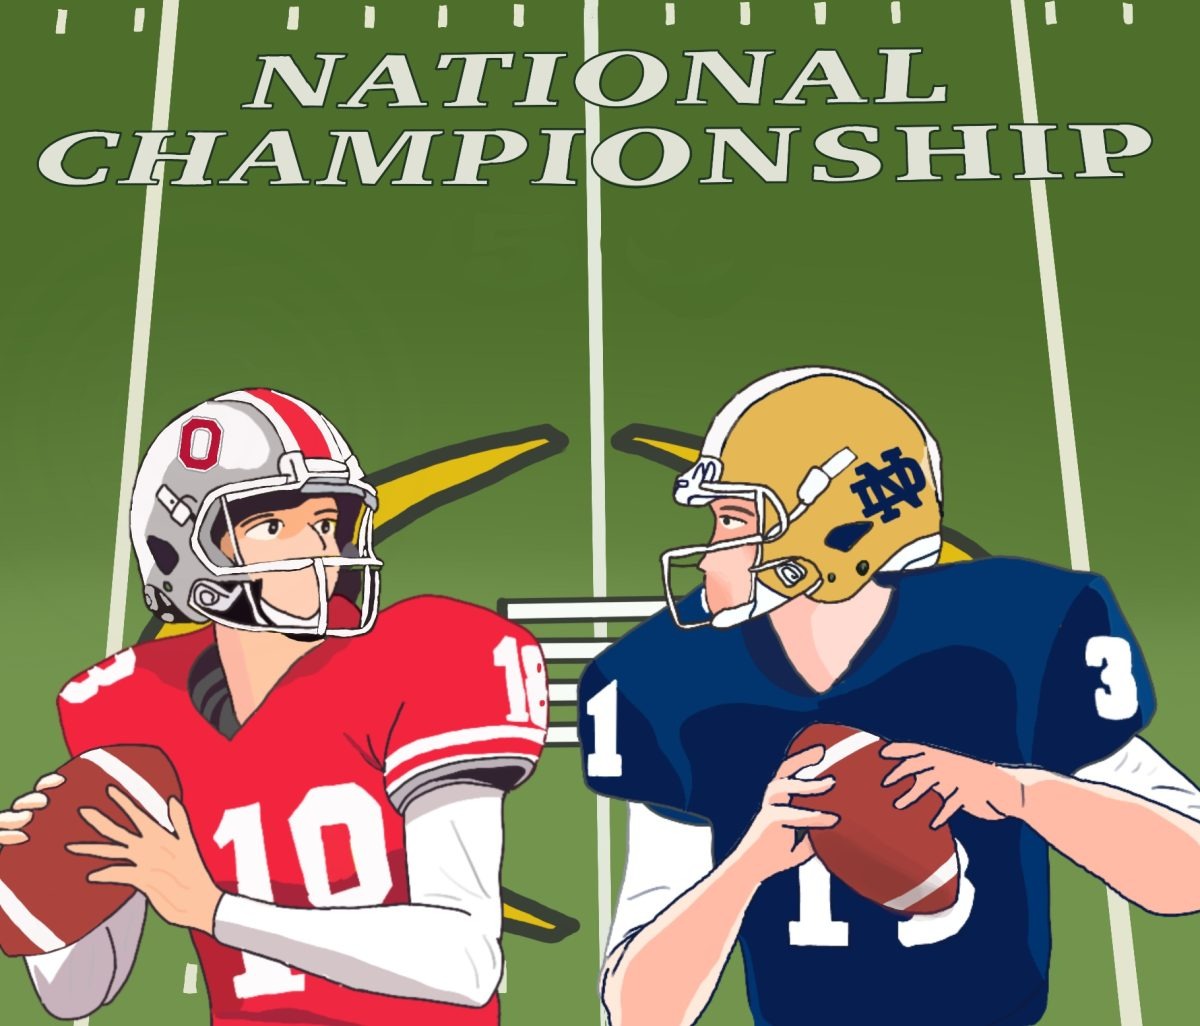
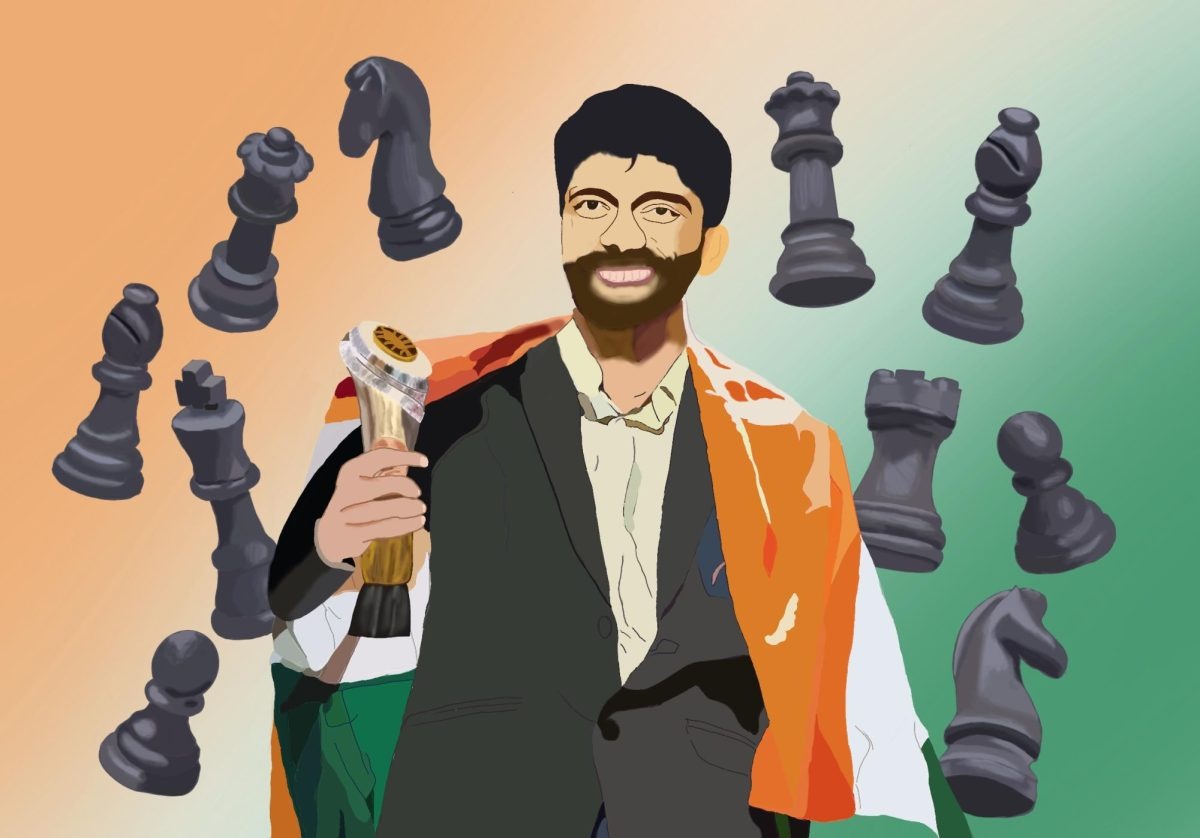
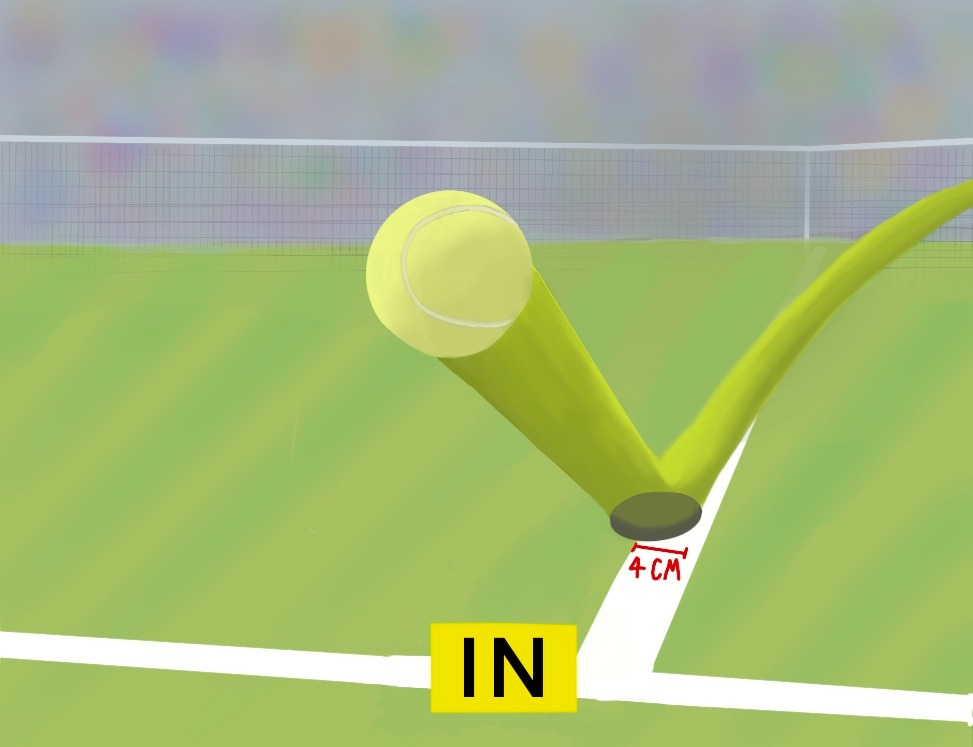
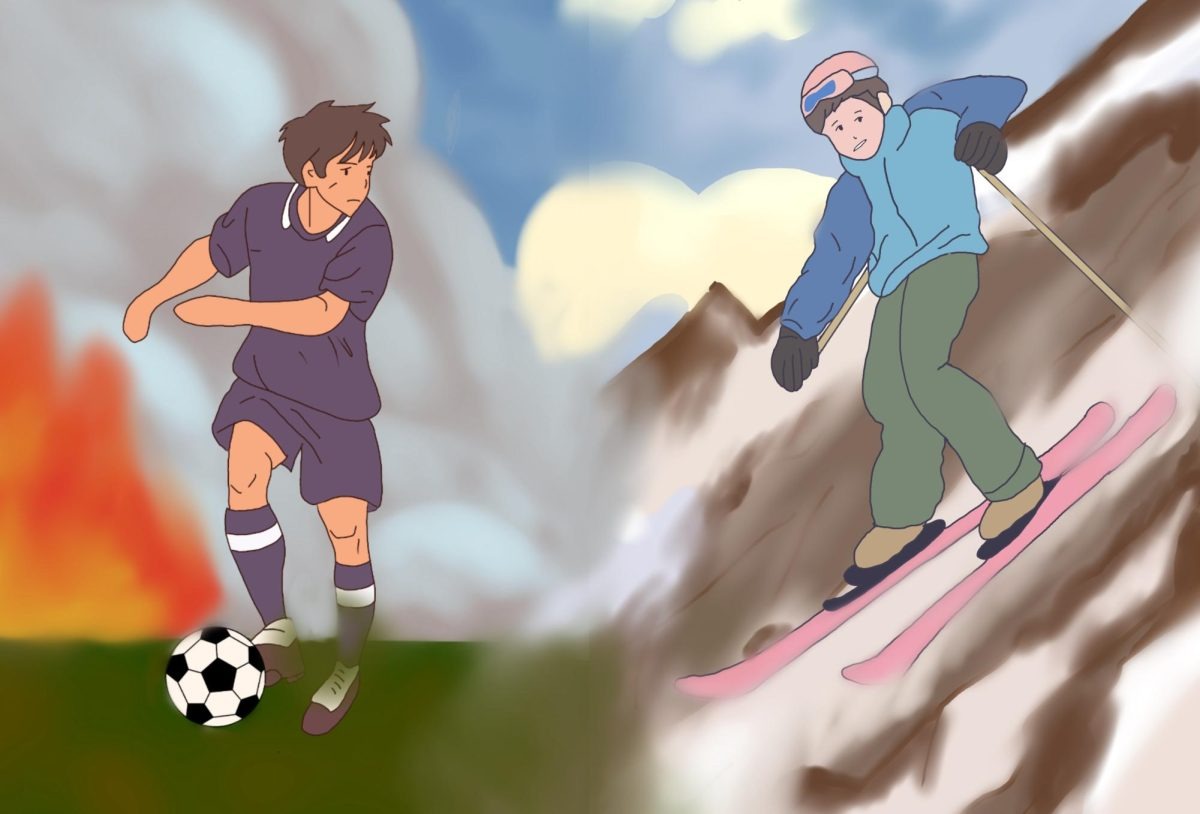
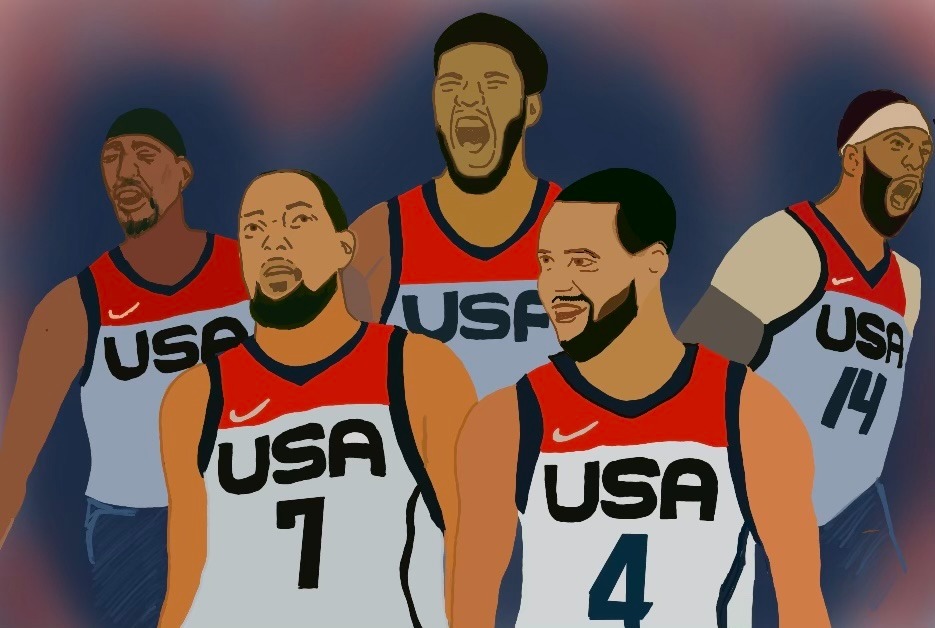
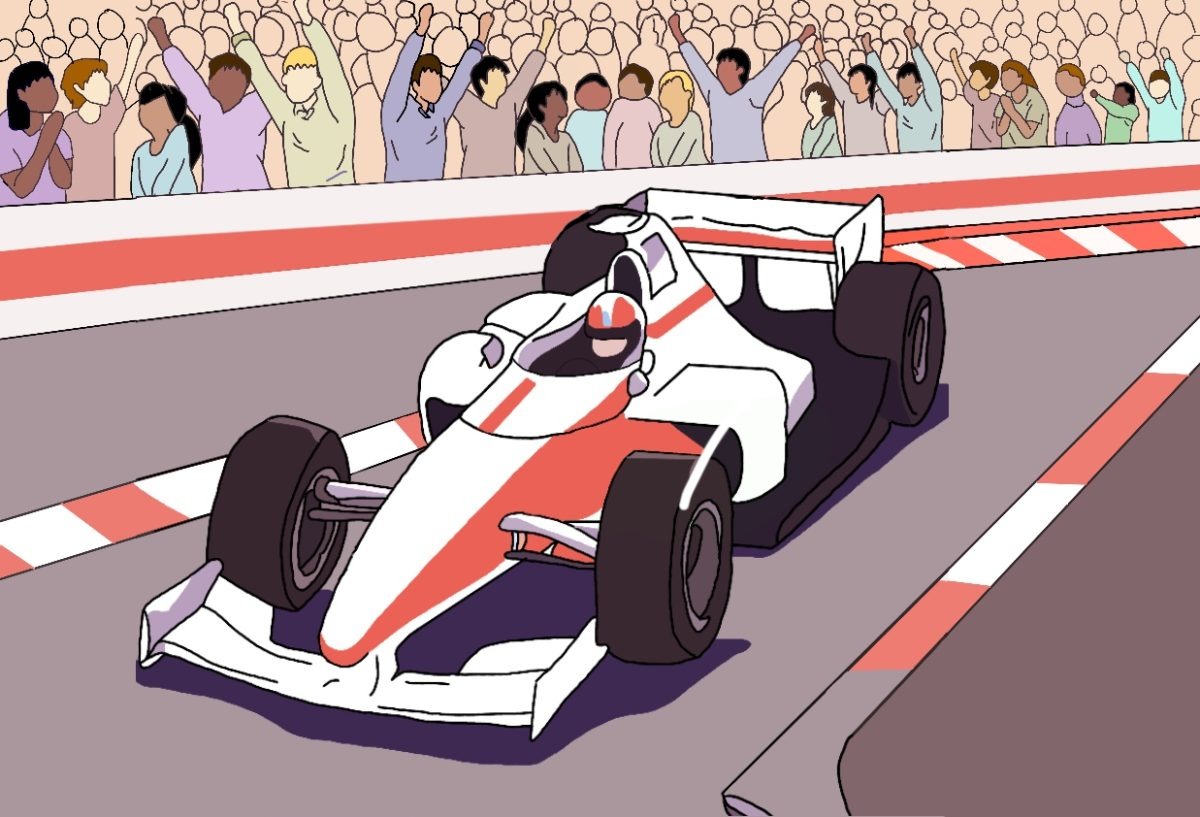
Explore a featured selection of my illustrations below.
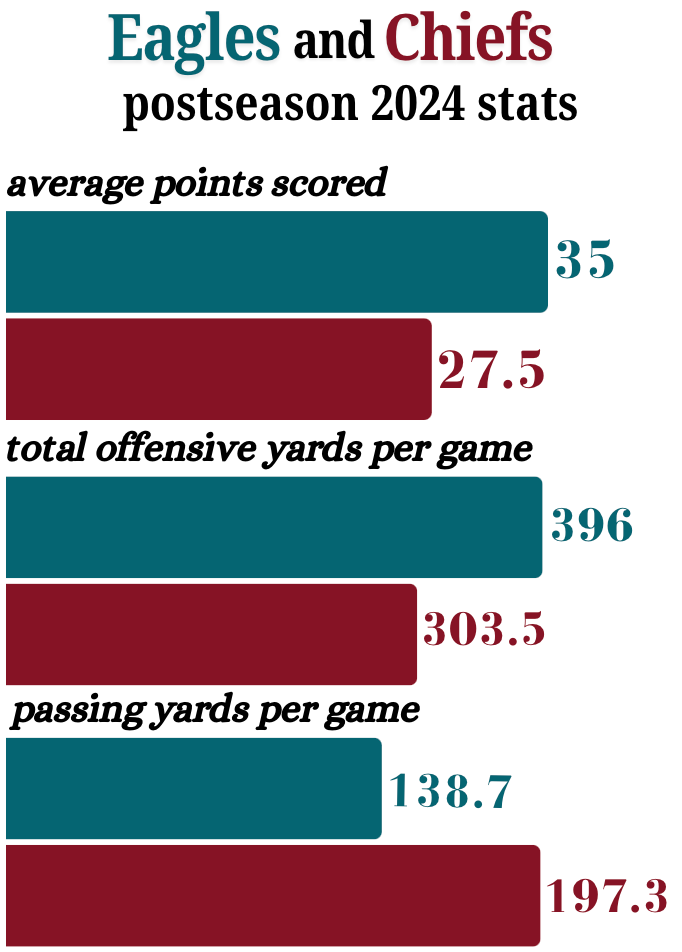
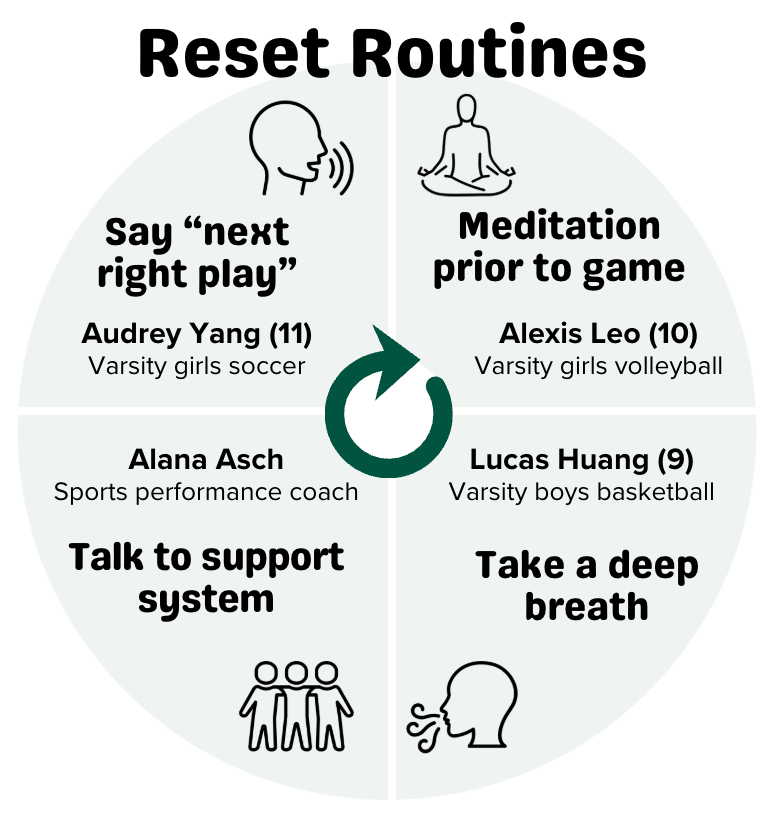
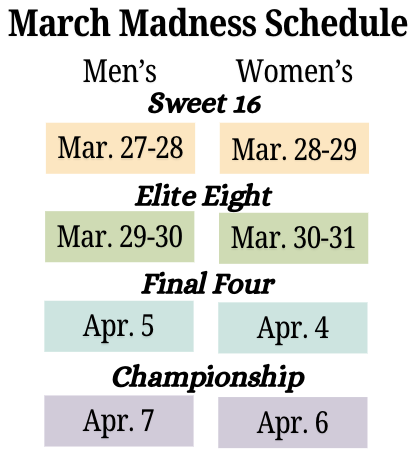
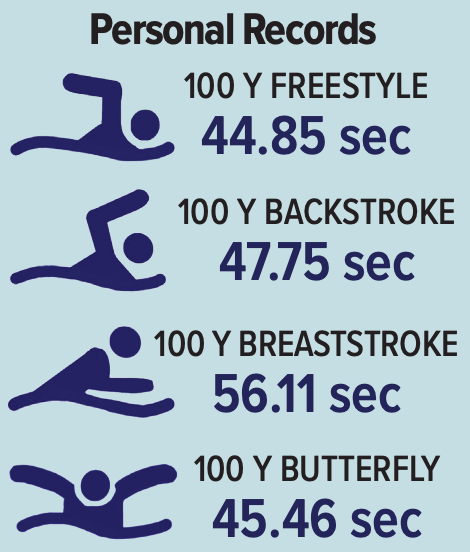
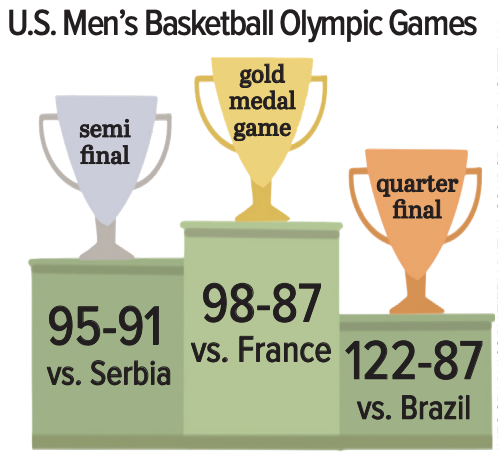
To create engaging pages and Aquila drafts, I made various infographics to visualize numeric and textual data. In each infographic, I aim to create color schemes that match the topic at hand (like Eagles and Chiefs colors) and are easy to read. Like all other aspects of journalism, infographics take iterations and patience, but the finished product always elevates how various information is conveyed. Please take a look at a selection of my infographics below, and hit the arrow key for more.